The OTbase TA comes with three dashboards that allow you to check right away if your TA installation is performing properly, and also to execute meaningful searches without having to invent SPL search queries on your own. All dashboards are accessible from the main menu of the OTbase TA.
The Devices dashboard
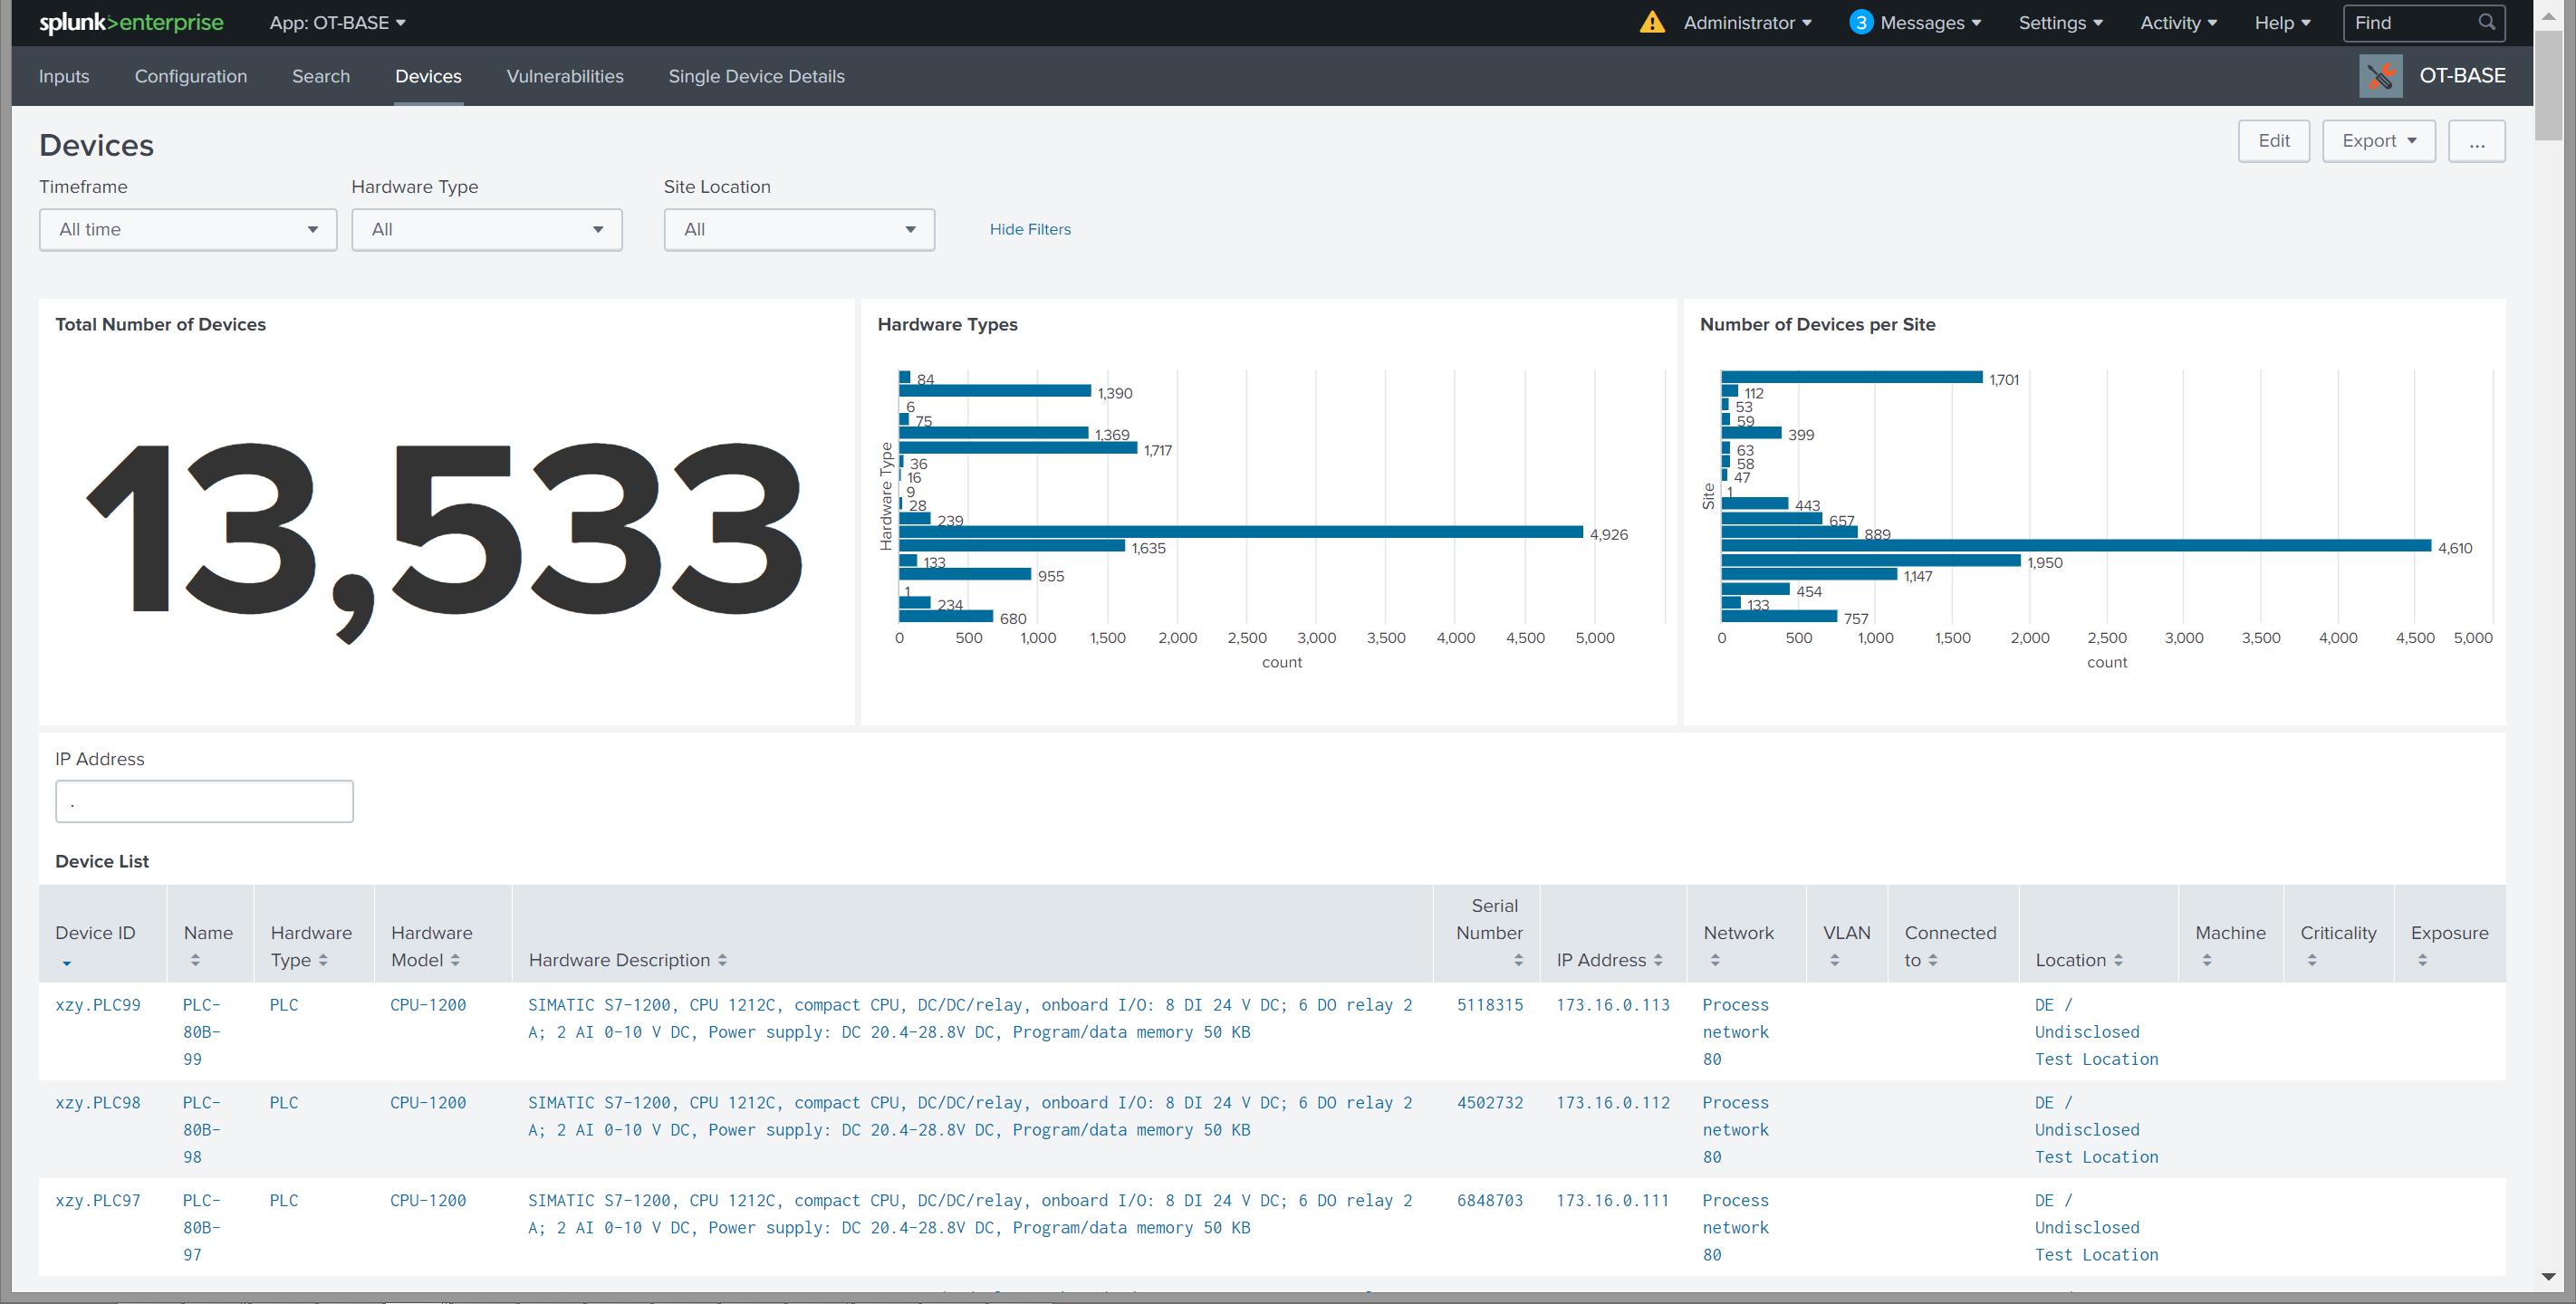
The Devices dashboard shows asset data along with some basic statistics. In the upper section you see three panels displaying the total number of devices, the number of different hardware types as a bar chart, and the number of devices per site, also as a bar chart. Notice that depending on your screen size, lables for the Y axis of the bar charts may be hidden, but you get a description of the data points when hovering over the bars.
Below the panels you see a device list that displays various information about the assets. You can search for a specific IP address in the input field right above the table.
Note that clicking on any device row will show details for that device in the Device details dashboard.
The Device details dashboard
The device details dashboard is usually accessed by drilldown from the Devices dashboard, but you can also access it directly and then provide the device ID for the device that you want to inspect. Note that in the latter case the dashboard may take some time to load because it gathers the device IDs for all devices for display in the input field.
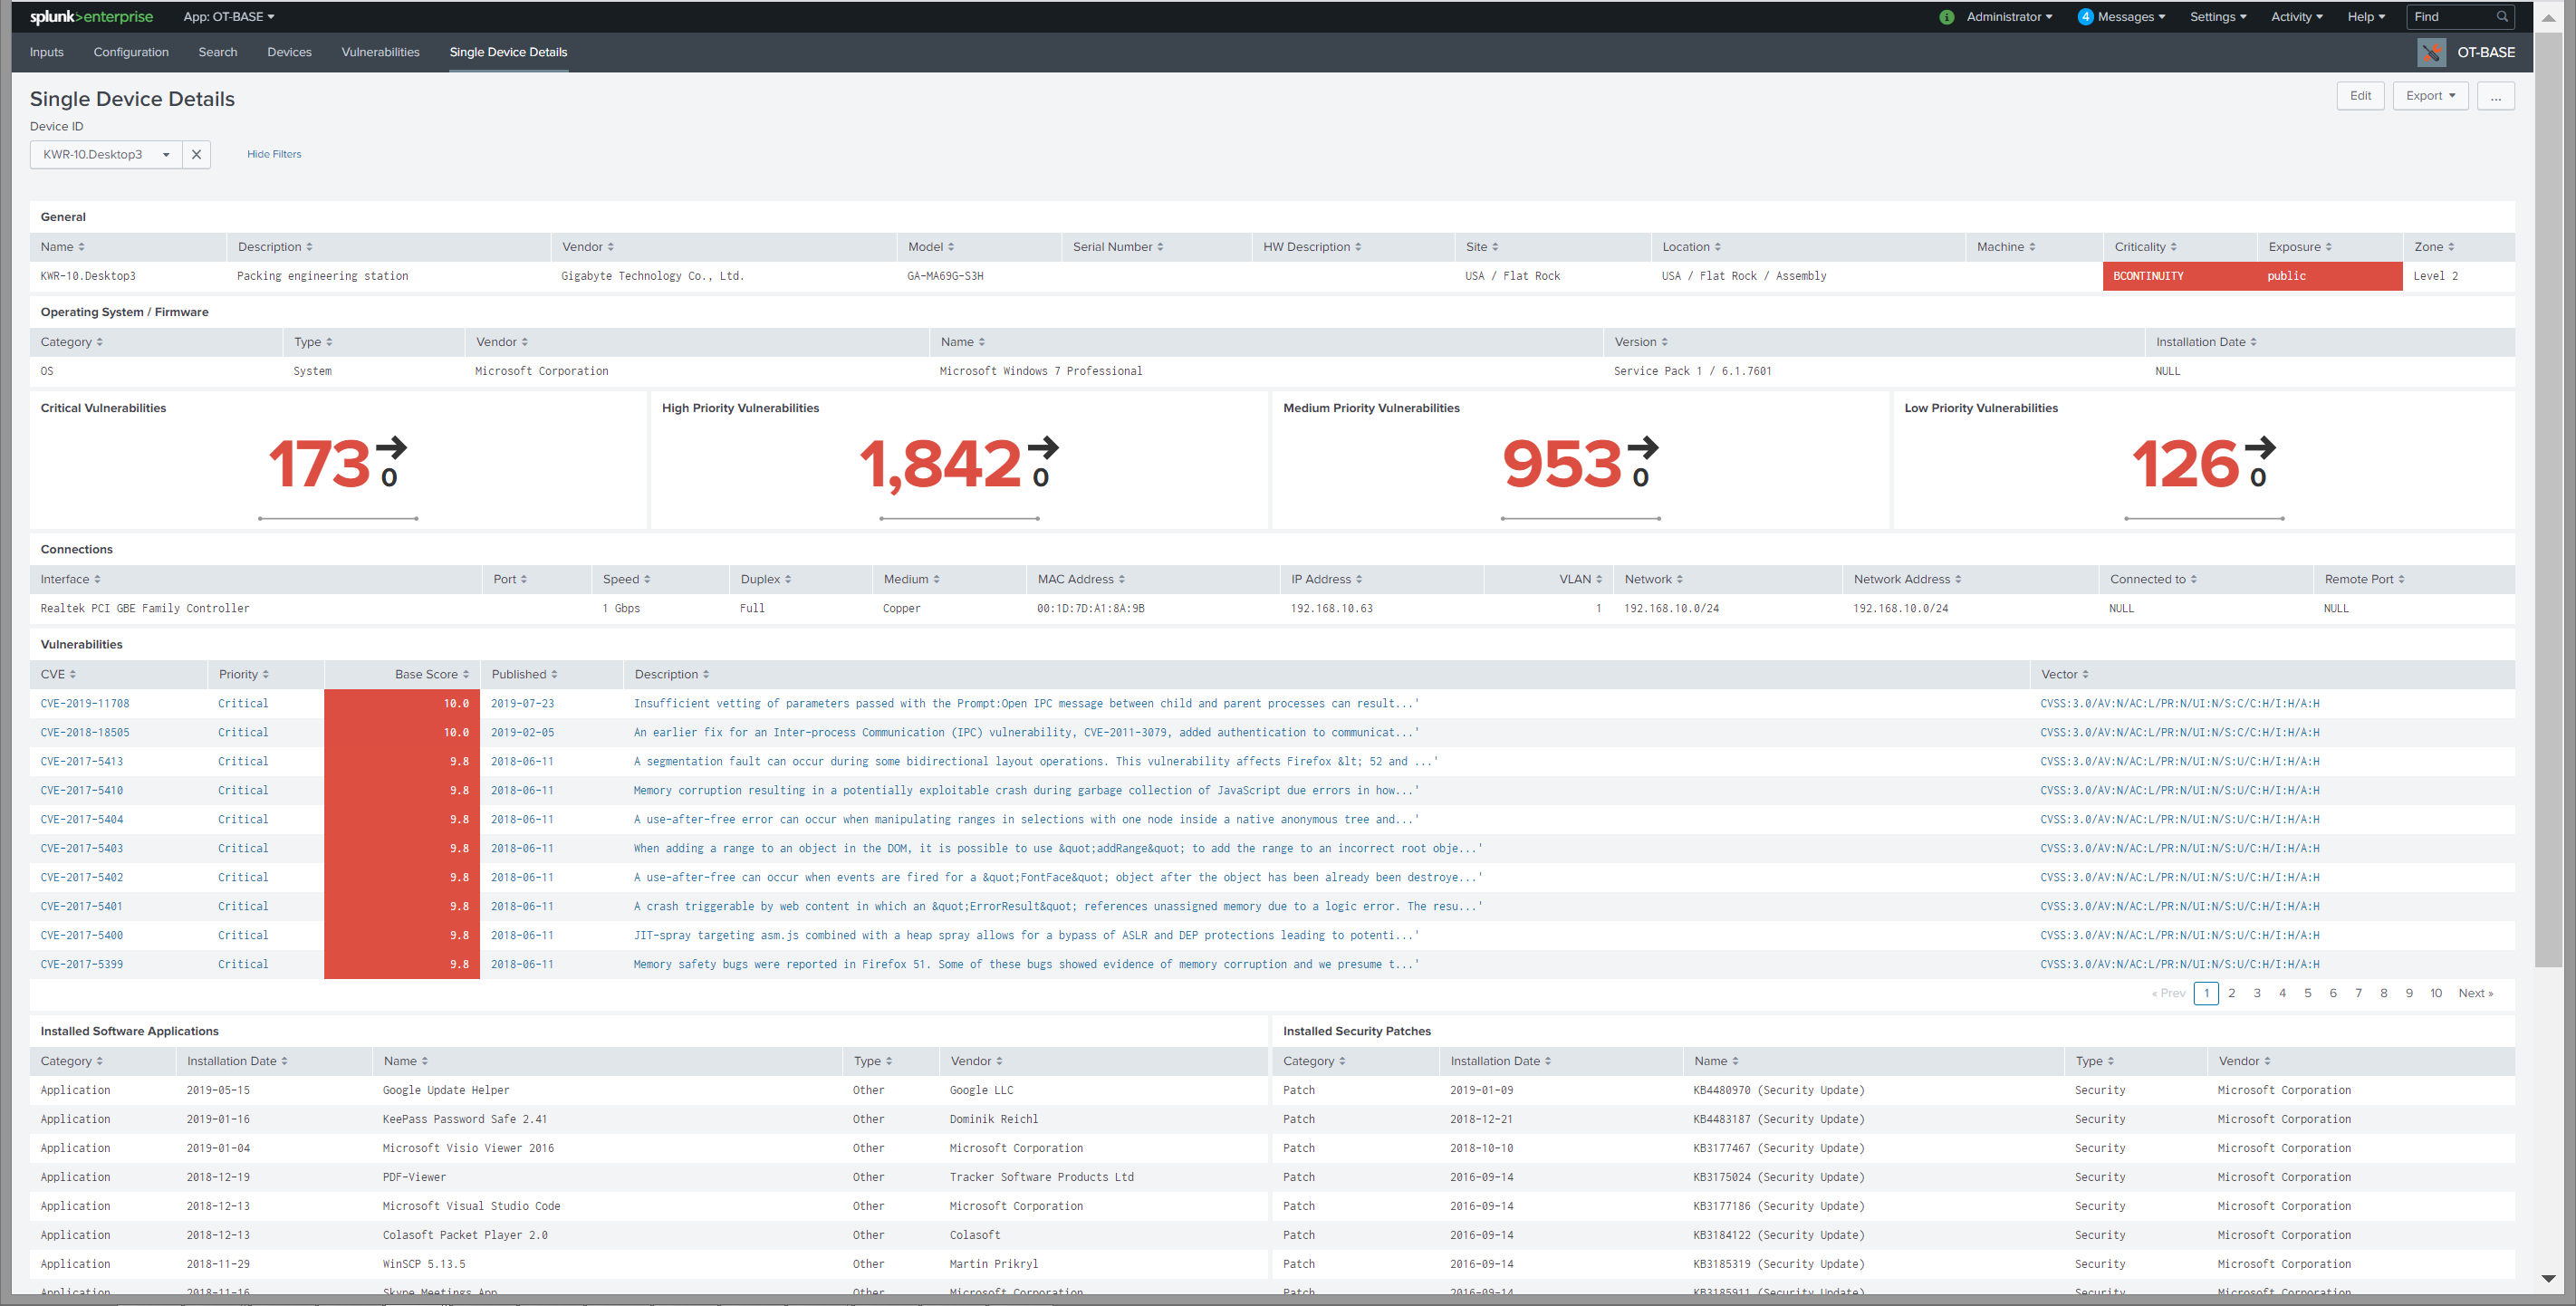
Clicking in any of the vulnerabilities listed will open the NIST CVE details for that vulnerability.
The Vulnerabilities dashboard
The Vulnerabilities dashboard is mostly intended for users who don't use Splunk Enterprise Security. In this situation, the Vulnerabilities dashboard gives you a means to get a basic understanding of your vulnerabilities in Splunk. Note that OTbase Inventory has many more capabilities to analyze and visualize vulnerability and risk.
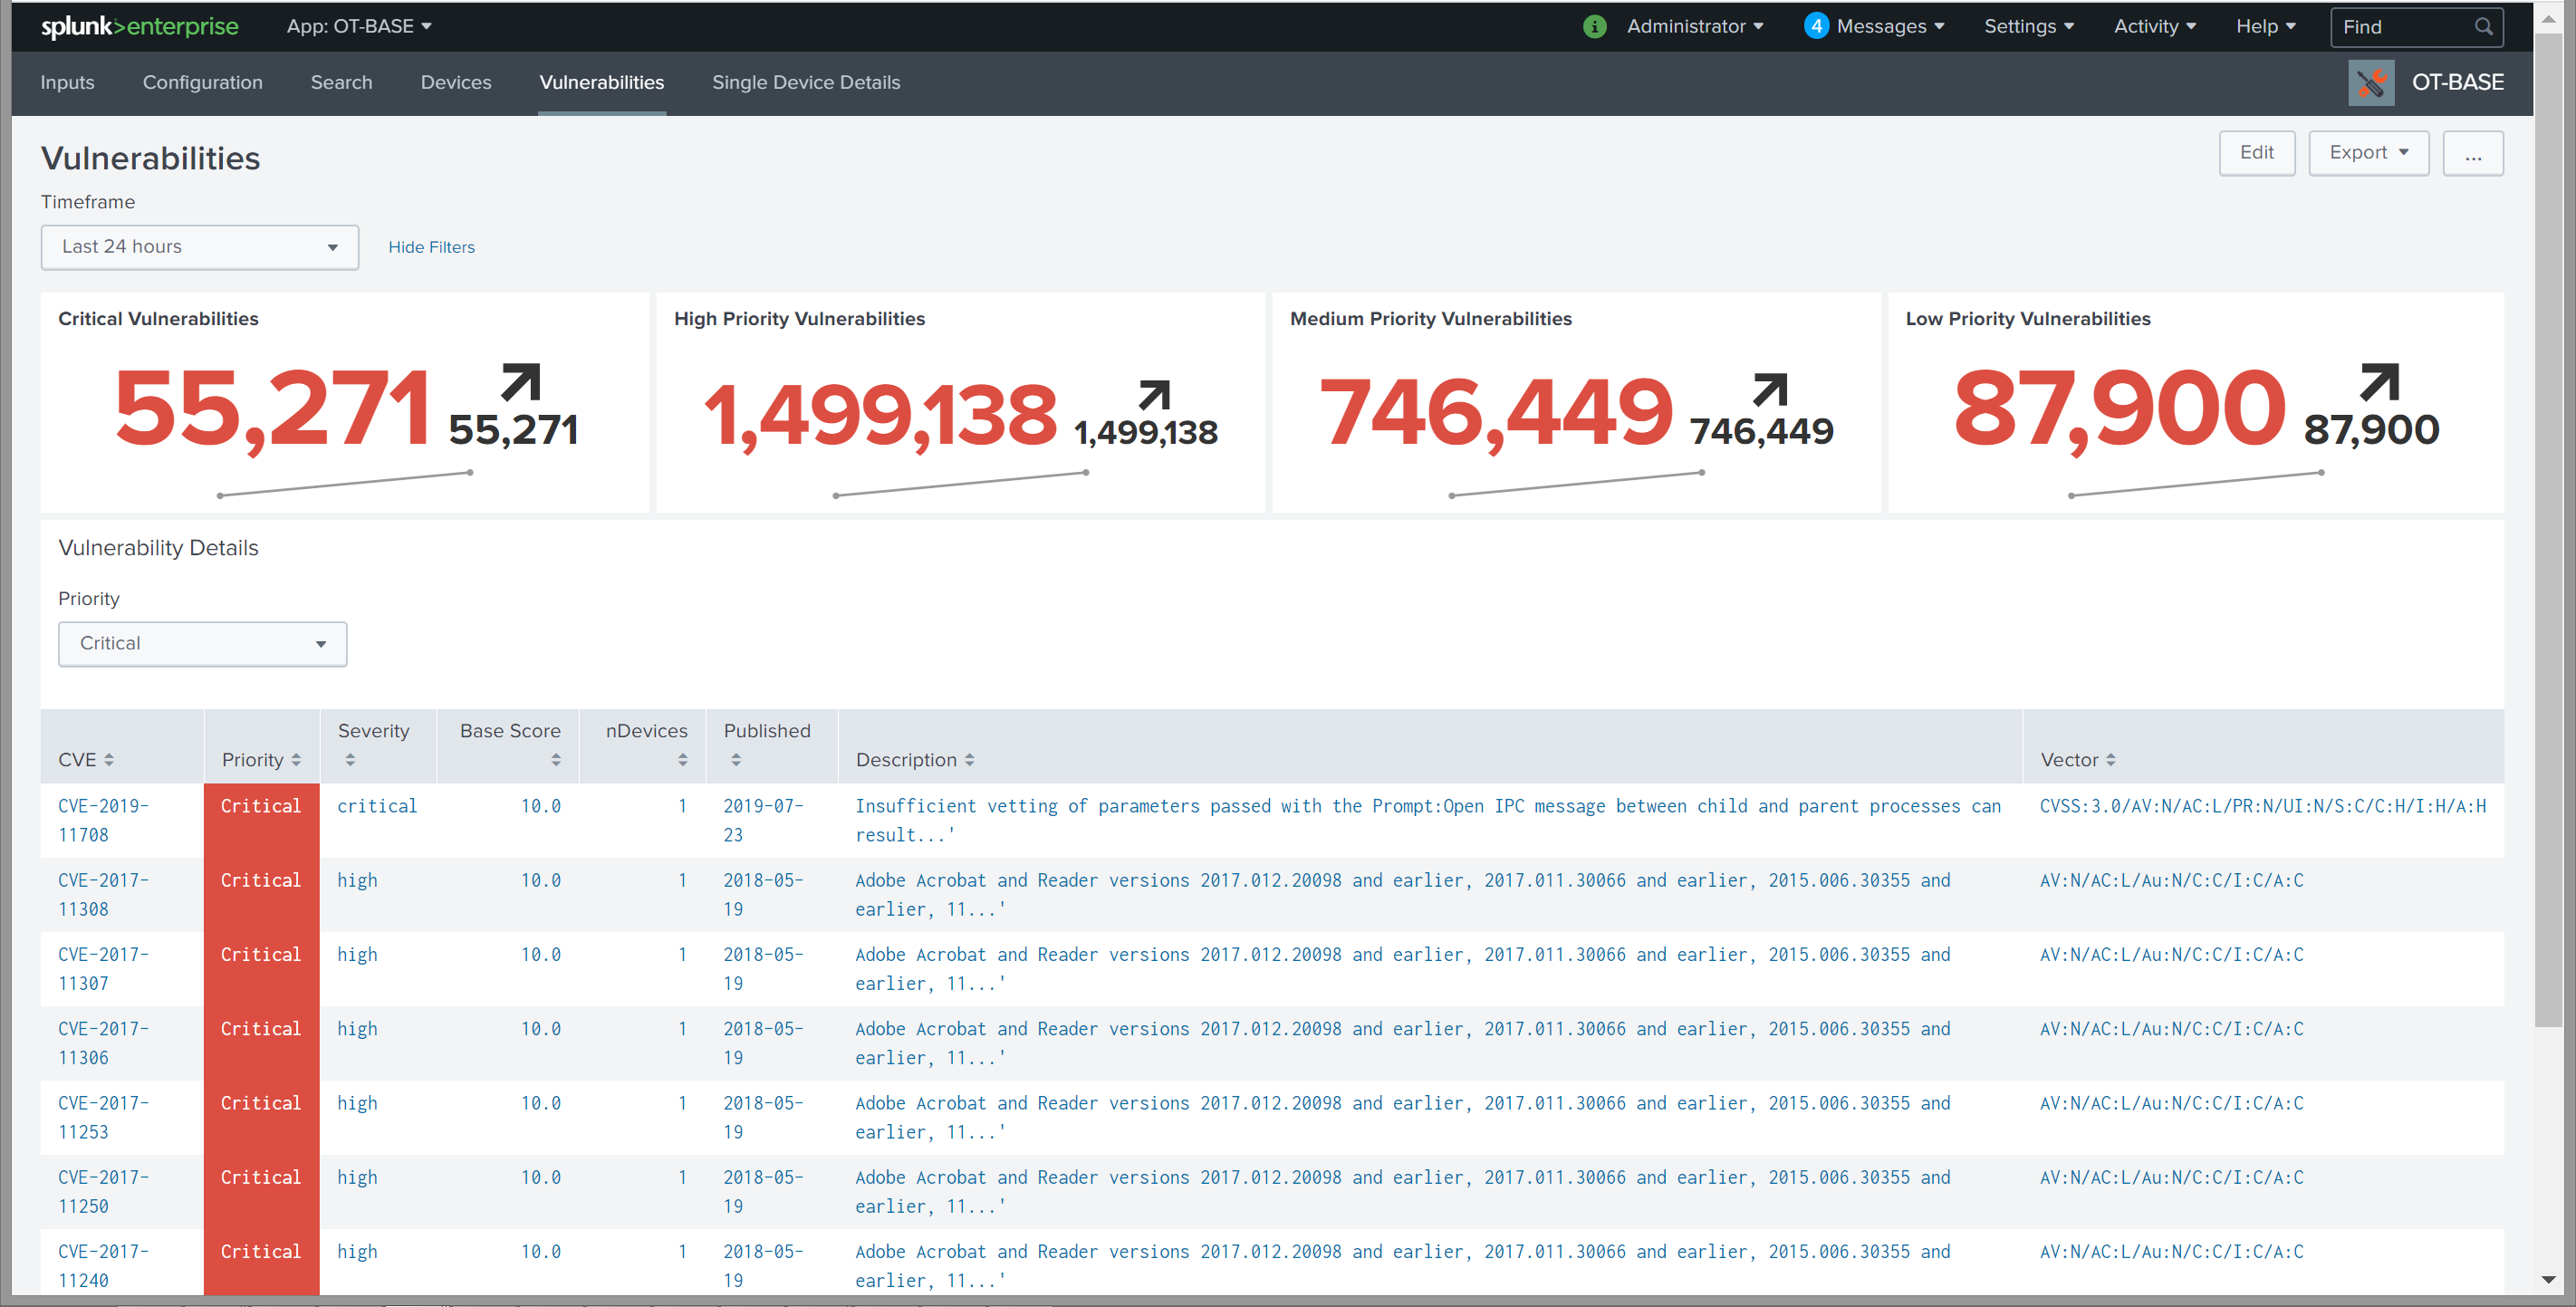
A drill-down into a vulnerability listing will open the NIST CVE details for that vulnerability.
Comments
0 comments
Please sign in to leave a comment.