The CVE chart allows you to track the number of vulnerabilities that are relevant for your installed base over time. In three different graphs that share the same timeline you can see
- The absolute number of CVEs
- The amount of changes in the number of CVEs
- The cumulated Vscore (all CVSS base scores of all vulnerabilities for all devices summed up)
- The total number of installed security patches.
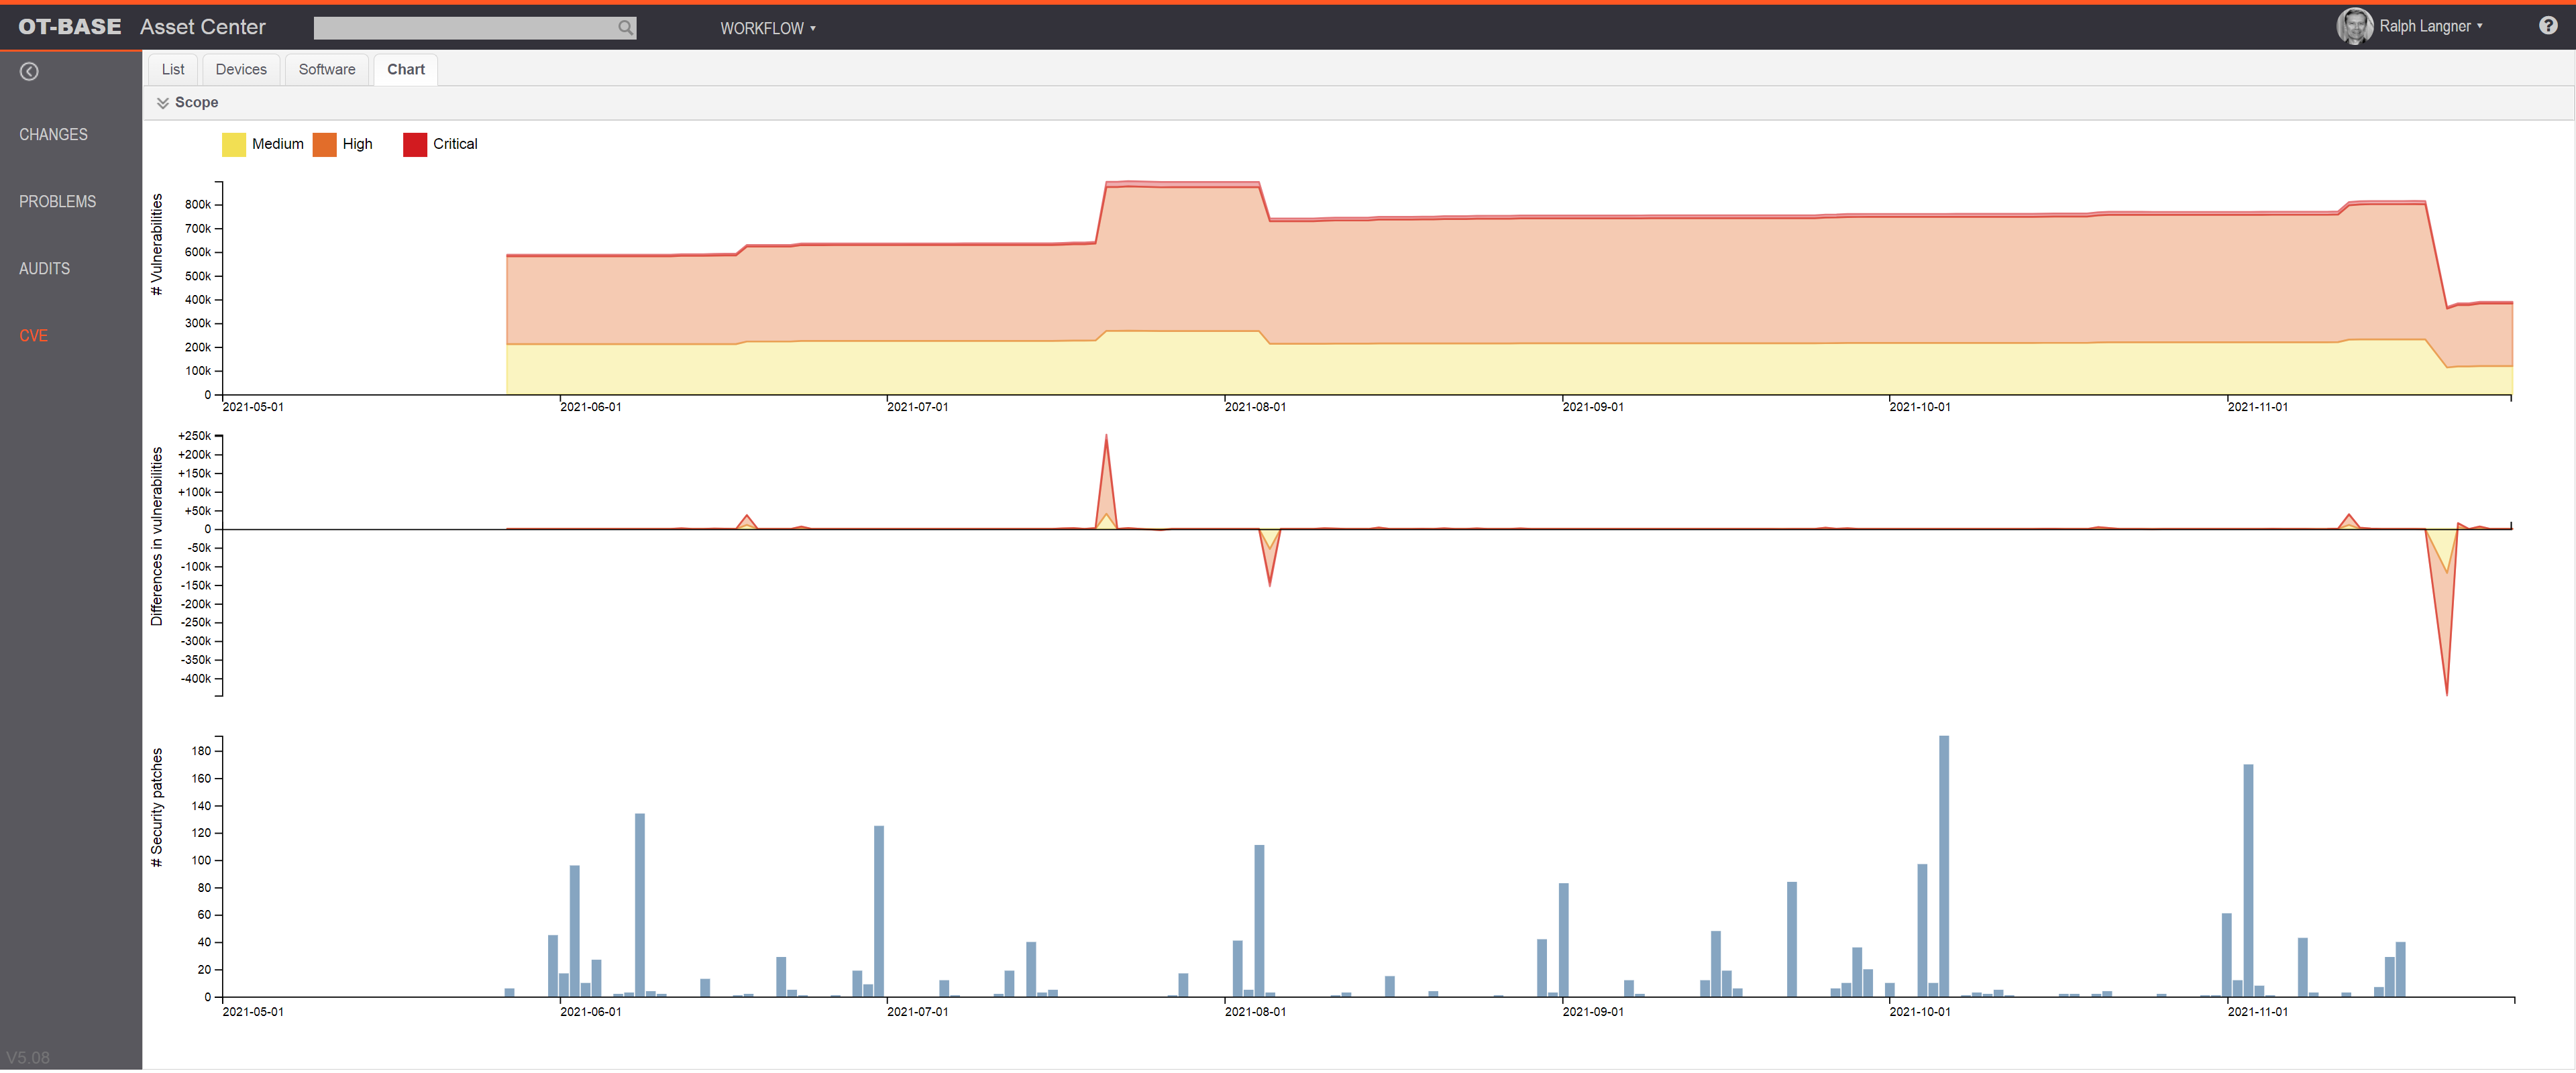
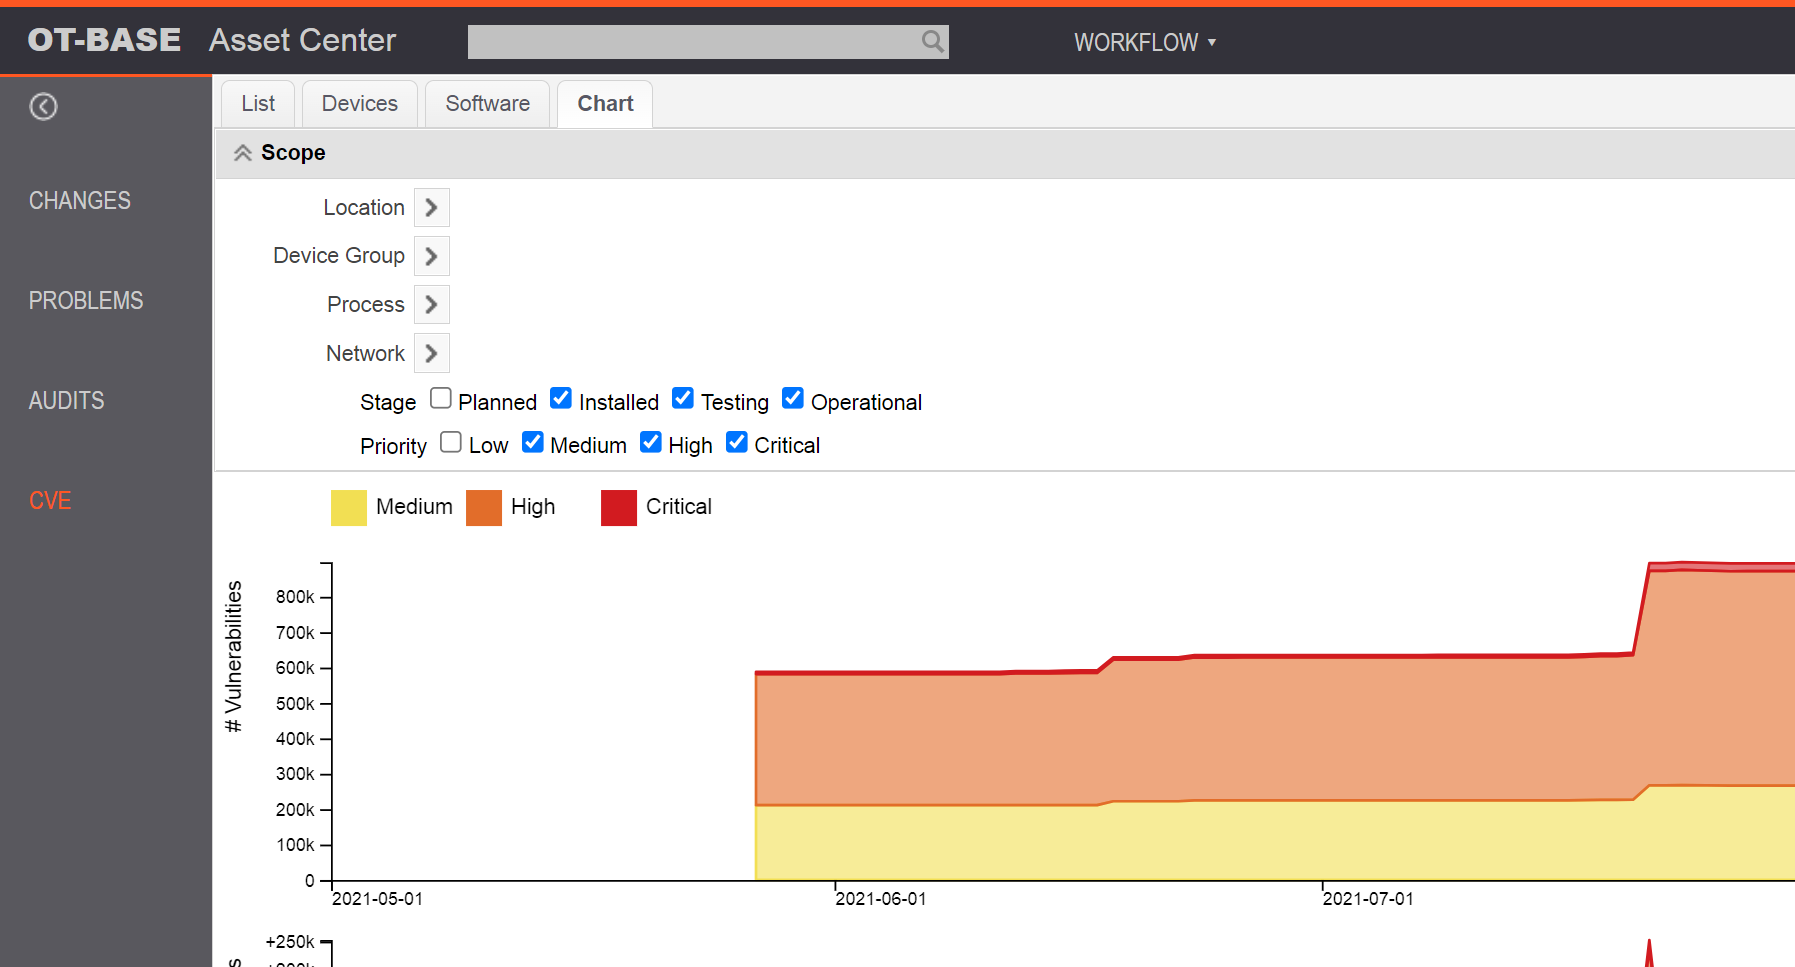
A scope selector allows you to focus on specific parts of your installed base, and on CVEs of certain priority.
Comments
0 comments
Please sign in to leave a comment.